You are here
Speed Testing

There are four examples tests that can be performed. The different tests are explained below:
Application Speed - Application speed is performed over a single connection thread and measures the actual real end-to-end speed that a TCP application will achieve for the connection being tested.
Capacity Speed - Capacity Speed tests a connection over multiple connection threads and is not usually a measure of how a connection will perform when used for most web applications, for example to view a video or listen to music.
HTTP - MySpeed provides two test methods for the bandwidth test: TCP socket-to-socket and HTTP. The socket-to-socket download and upload speed tests provide the most accurate speed tests available.
Auto-start - This just performs a regular speed test but the user doesn't have to click the start button. The test starts automatically. This feature is availble for all tests.
To BEGIN THE TEST click the CLICK TO START TEST button.
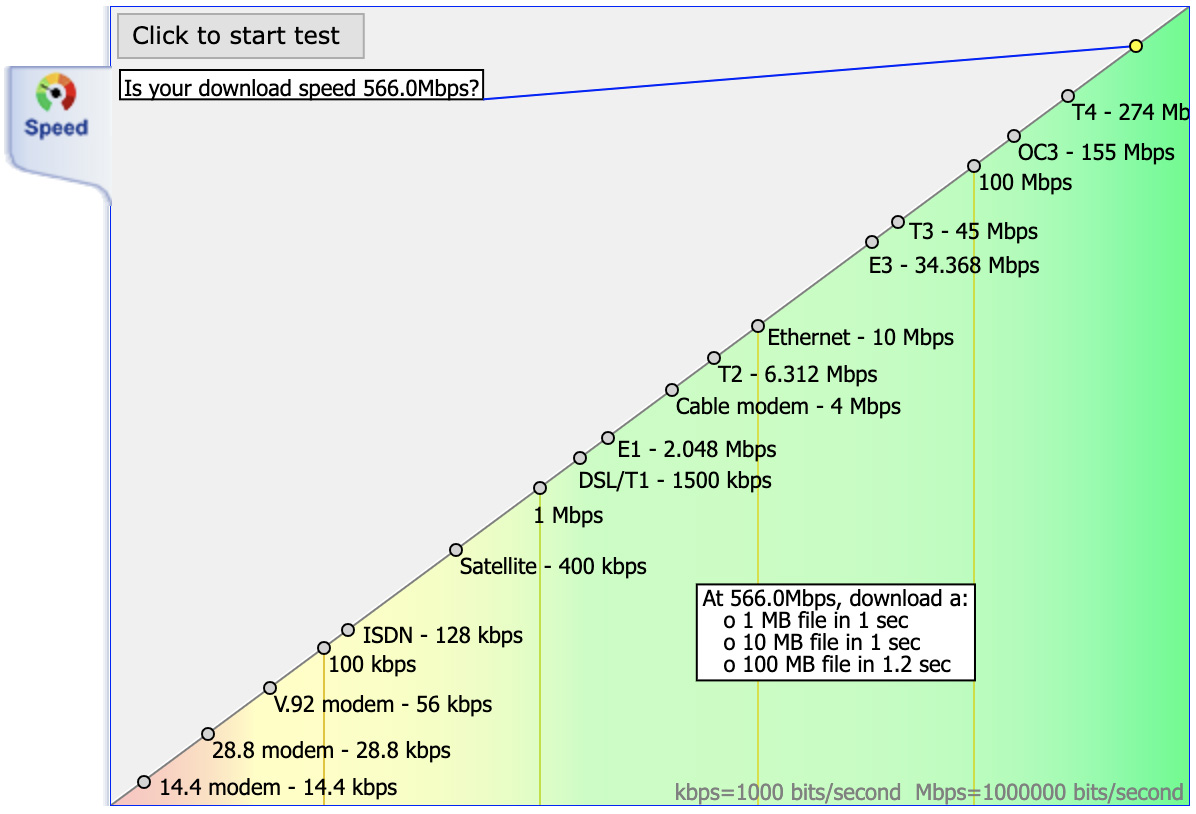
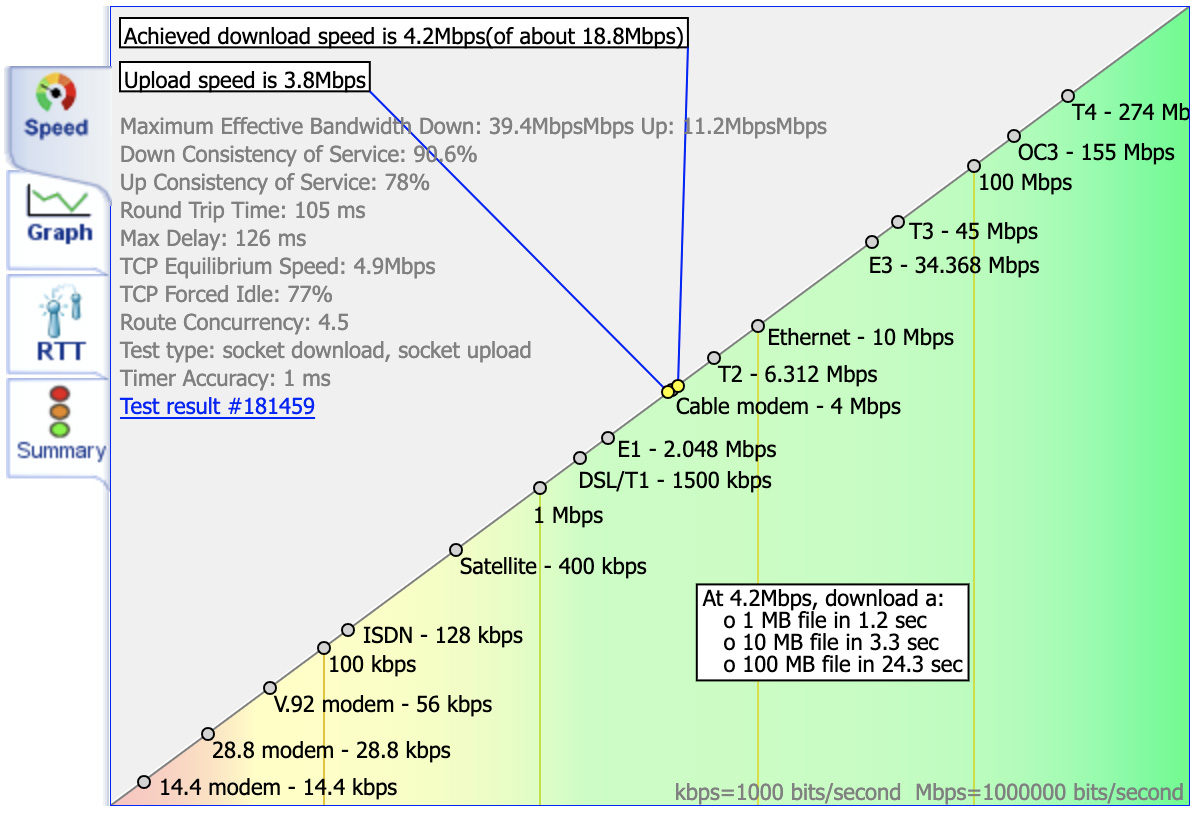
First of all the download test will be plotted followed by the upload test. Once the test has been completed more tabs will appear and the results will be displayed as shown on the right.
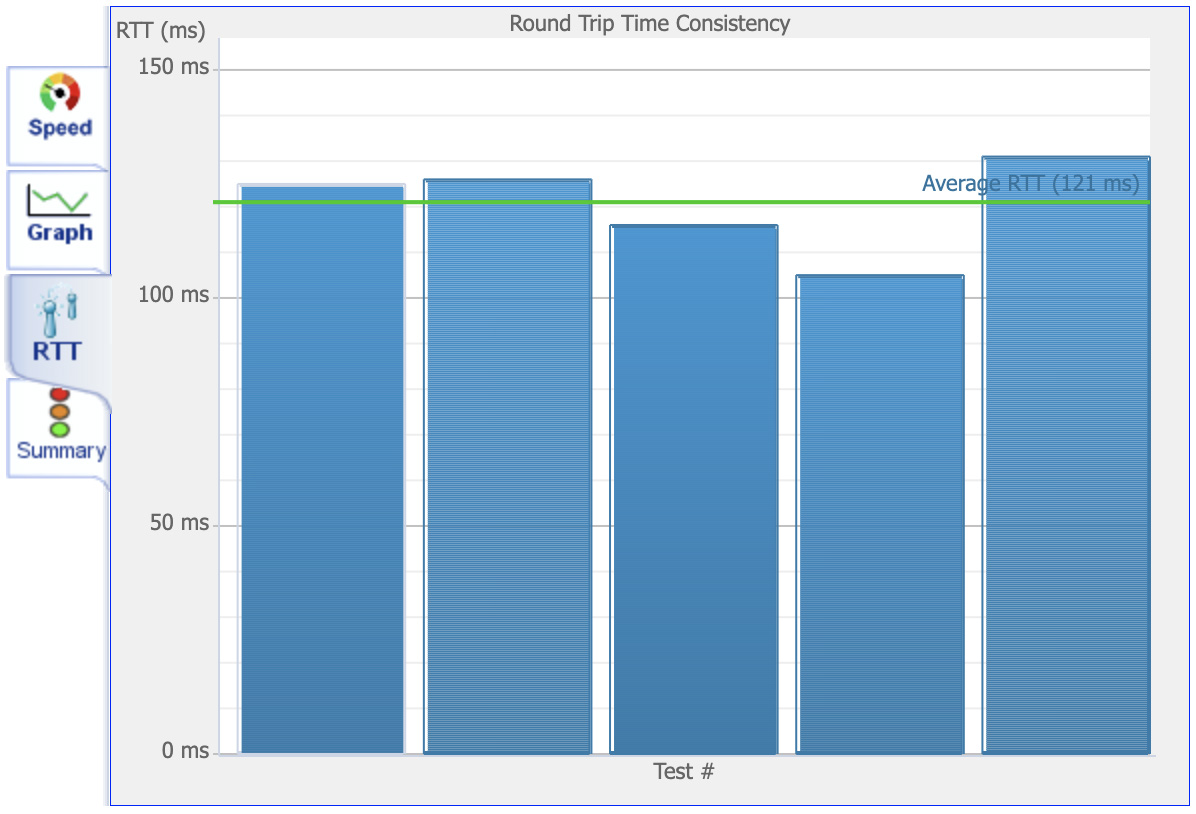
The RTT (Round Trip Time) tab, shown on the right, plots the reponse times in a bar chart view for each of the packets sent out during the test.
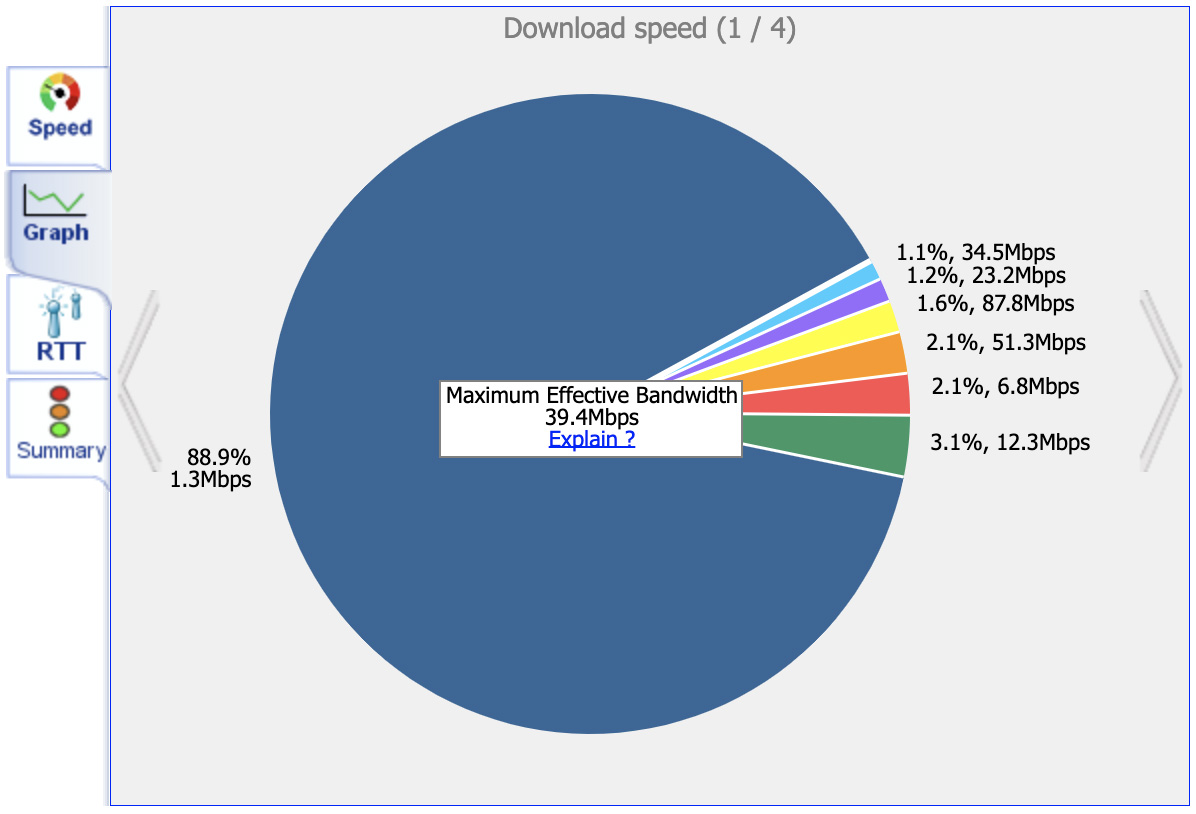
The pie graph reports the throughput distribution over the test. This data is important because many popular speed tests mislead the customer by reporting a max attained value of ‘x’ Mbps rather than the true throughput speed. Max attained values are a bit like reporting 60Mph speed on a 50 mile commute when you attained the 60Mph for 1 mile of the journey and had an average speed of 15Mph. The pie reports a normalized max attained value but also clearly shows the true overall performance attained during the timeline of the whole test.
Consider this real-life example. A 10 mile stretch of road has a speed limit of 60 miles per hour. There are 5 intersections on this road with a set of traffic lights. If a vehicle travels end-to-end in 10 minutes, the vehicle has indeed traveled at 60 miles per hour. If a vehicle travels end-to-end but catches every light red, which causes the journey to take 15 minutes, then the vehicle would have traveled at a peak of 60 miles per hour but the throughput would have only been 40 miles per hour.
The TRUE performance of the first vehicle is 60 miles per hour, the TRUE performance of the second vehicle is 40 miles per hour.
Most testers do not measure throughput speed but instead attempt to measure Capacity and report the result as 'speed'. Network providers like speed testers that show highest attained because it makes dollars however a capacity test does not measure one vehicle but several vehicles at the same time, reporting the combined value over the time line.
The question to ask is therefore this, if 10 vehicles travel the 10 mile road in 10 minutes and the test reports a result of 1 vehicle per minute, does that really mean the vehicle's speed was 600mph or is it really still 60mph but there is 10 of them. Better yet, is 9 babies born in 9 months, 1 baby a month or is the experience of a mother still 1 baby in 9 months.
Which measure matters? The answer depends on who is asking the question. The service provider would argue that the 40mph vehicle did indeed travel at 60mph, therefore 60mph is the 'bandwidth'. The driver of the vehicle would argue that while 60mph was attained it was not sustained, the throughput was only 40mph. Bandwidth is not a speed it is simply a rate, speed is really throughput with the upper limit being the bandwidth. The throughput measure is what really matters because it defines the overall user experience. The user experience is what really matters. Imagine driving the '10 mile road' to catch a train that leaves in 12 minutes. The first vehicle in the example will catch the train with 2 minutes to spare, the second vehicle in the example will miss the train by 3 minutes. Networks are about delivering data on time… knowing you traveled at 60mph for part of the journey is of little benefit if you miss the train.
If MyConnection Server measures throughput, why report effective bandwidth? MyConnection Server reports the effective bandwidth in conjunction with the breakdown of the bandwidth attained over the test time line; this allows the testing user to truly assess the service quality that is being provided. While many of the most popular speed testers report nice glossy numbers with cool graphics, these measures are largely of little value and wholly misleading. Few tests if any report the consistency of speed attainment but the experience of the user is defined by this metric.
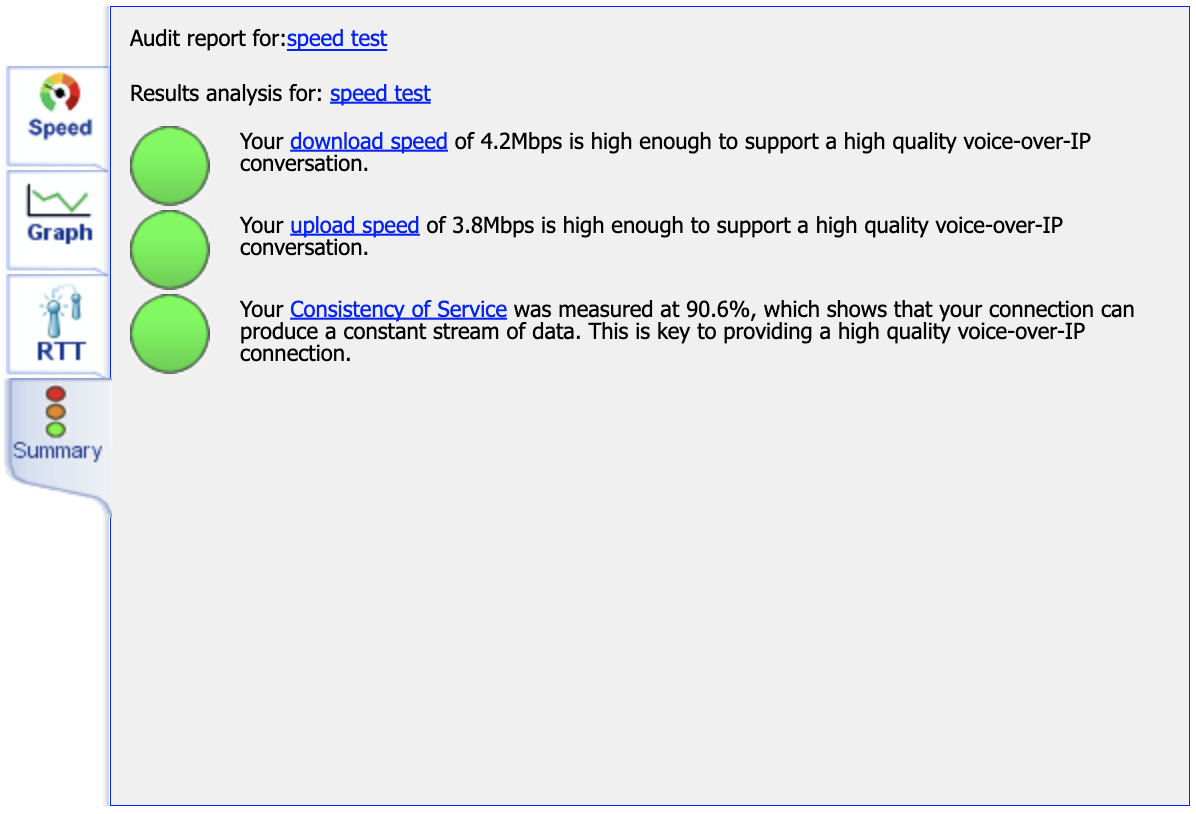
The summary tab shows a summary of the connection data collected from the test. The colored circles to the left of the text are there to give a quick indication as to whether the test was good or bad. In the example above the download and upload tests are of a good speed but the quality of service is bad which means although the speed was good, it was not consistent.